Gully Maintenance Status Report
The Gully Maintenance Status Report uses the Gully Maintenance Activities to report on the last Maintenance Activities, and predict the level of Debris that is likely to have accumulated in the Gullies. This prediction is based on past records, and gives the date at which a Gully is likely to reach an 85% level.
These predicted dates are compared to the Minimum Inspection Interval (say annual) and the report identifies the next appropriate action. The report is displayed in a standard Grid Display Panel, and the results may be printed / exported to file for further analysis.
The report may be accessed from the HighStone menus:
RMMS Works Orders, Surveys, Defects\
Network Surveys Maintenance\
Gully Maintenance Status Report
Alternatively the report may be called from the Network Survey Details panel - where it is listed under the Actions menu. In this instance the report is prepared for all Network Sections listed in the current Network Survey.
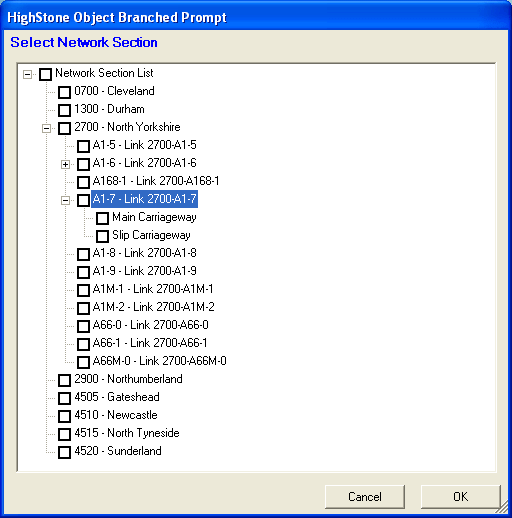
If the report is called from the HighStone Menus, a prompt is given to specify the range of Network Sections that are to be included. Use the checkbox selections to specify the required range.

There is no 'Entire Network' option for the report.
The Report includes ALL Drainage Items relevant to the report - there is no Left Edge / Right Edge filter. The Asset Items types are defined - but this may be adjusted by referring to the configuration scripts for this report (see Configuration Details).
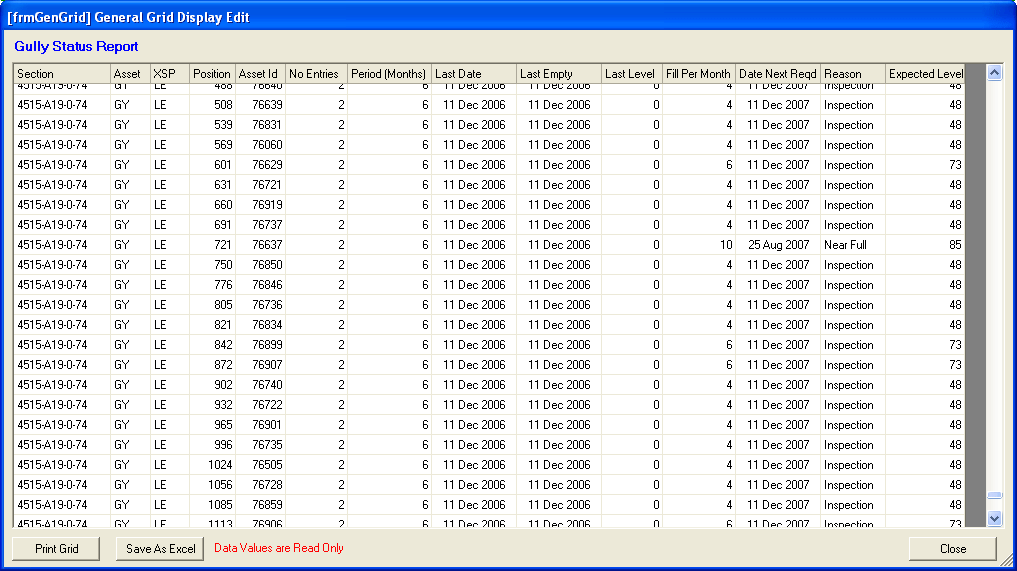
The report is displayed in the General Data Grid panel, and the results saved from here as required.

The following steps make up the calculation
-
The report includes all relevant Drainage Asset items in the report, listing them by Network Section, Cross Sectional Position, Location (Chainage).
-
If no Maintenance Records are found for any Asset Item the display shows 'No Data' in the Reason column. No other calculations are given for such items.
-
If only ONE Maintenance Record is found, this last entry is listed and the Date Next Reqd is set to the next required Annual Inspection Date [based on the Minimum Inspection Interval]. The Reason column shows 'Inspection'.
-
The report lists the date of the last Maintenance visit (Last Date), the date the Asset was last Emptied (Last Empty) and the level of debris recorded after the last visit (Last Level). Last Level will be zero if the Asset was emptied at the last visit.
-
If two or more Gully Maintenance records are present, then the average Fill Rate (as a Percentage Fill Per Month) is shown. This figure is calculated as an Average Rate over all previous records; there is no adjustment for seasonal variations.
-
If the Last Level entry is 85% or more then the Reason column is shown as 'Gully Full' - it is assumed this will be attended to as a priority.
-
HighStone estimates the date forward as to when the Asset item will reach an 85% level of fill. The result is shown as:
-
If this point is reached before the next regular Inspection Date, the Reason column shows 'Near Full', and the date calculated is shown as the Date Next Reqd, the Expected Level is also shown (will be around the 85% level).
-
If the next Regular Inspection Date is reached before the Near Full level is reached, the Reason column shows 'Inspection', the required inspection date is given as the Date Next Reqd, and the predicted level of fill shown in Expected Level.
-
The Asset Minimum Inspection Interval is defined in the HighStone Configuration definitions - the default is 12 months (365 days).
The Prediction calculation assumes that valid and (reasonably) accurate records are maintained. The following specific points should be considered:
-
It is important that the Level of Debris in each drainage asset is recorded before it is emptied.
-
Regular Maintenance Schedules will pick up all drainage assets within each Network Section, however any ad-hoc cleaning due to reported flooding etc must also be recorded. If this is not done then HighStone will underestimate the predicted fill levels.